Variance is something that gives a measure that tells us how spread out a set of data values are.
But we will expand more on what is variance in Math.
For a set of data values, the Variance is the sum of each squared distance of a value from the mean/average of the data set, all divided by the amount of values that there is.
That definition can be a bit much to take in all at once, but things should become quite clear with some detailed examples further in the page.
Firstly though it can help to have a look at some examples of calculating the mean/average for a group of some numbers.
As sometimes an average value can be a good fit for a set of values, but there can also be times when it isn’t.
Examples
(1.1)
List of 8 numbers:
2 , 6 , 10 , 3 , 2 , 20 , 13 , 8
Mean/average = \bf{\frac{2\space+\space6\space+\space10+\space3\space+\space2\space+\space20\space+\space13\space+\space8}{8}} = \bf{\frac{64}{8}} = 8
The average of the list is 8, but it can be seen that some values are quite far away from that value, such as 20.
(1.2)
List of 8 numbers:
4 , 5 , 4 , 7 , 6 , 7 , 9 , 6
Mean/average = \bf{\frac{4\space+\space5\space+\space4+\space7\space+\space6\space+\space7\space+\space9\space+\space7}{8}} = \bf{\frac{48}{8}} = 6
The average is turns out to be 6, and all values in the list are indeed close to this value here.
Formula for the Variance
Earlier in the page it was mentioned that a definition of the variance is the sum of each squared value distance from the mean, divided by the total amount of values.
In examples (1.1) and (1.2) above, each set of numbers has 8 numbers, so the total amount of values is 8, that part is clear to see.
So how do we establish the sum of each squared distance from the mean?
If we focus on the set of numbers in example (1.2).
The mean/average of the list is 6, this can be labelled by the symbol μ. ( μ = 6 )
The list has 7 values.
We can also label each of these as an x subscript.
Distance from the Mean/Average
To calculate the distance of one of the data values from the mean, we just have to subtract the mean from that data value.So for x_4, which was 7.
x_4 − μ = 7 − 6 = 1
1 is the distance that the data value 7 is from the set mean/average of 6.
So the ‘distance from the mean’ squared, for 7, is 12, which is also 1.
Thus to calculate the Variance of the whole list of values from example (1.2).
We perform the same action that we just did with 7, but for every value in the list,
then summing each result up together.
Before finally dividing that total by the number of values there is in the list, n values.
Which gives us the formula for the Variance.
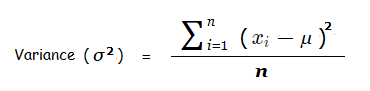
σ2 is the common standard notation for the Variance.
The distances of the data values from the mean are squared to keep their overall value positive, as positive and negative distance values added up together would result in some cancelling out and end up giving a false measure of the spread.
This can all be quite a bit to digest at first, but the process will become clear by looking at some numerical examples.
Finding Variance Examples
(2.1)
We can look at the same list of 8 numbers from example (1.1):
2 , 6 , 10 , 3 , 2 , 20 , 13 , 8 = { x_1 , x_2 , x_3 , x_4 , x_5 , x_6 , x_7 , x_8 }
n = 8 , μ = 8
\sum_{i=1}^8 \space(x_i \space {\text{–}} \space \mu)^2
= ( x_1 − 8 )2 + ( x_2 − 8 )2 + ( x_3 − 8 )2 + ( x_4 − 8 )2 + ( x_5 − 8 )2
+ ( x_6 − 8 )2 + ( x_7 − 8 )2 + ( x_8 − 8 )2
= ( 2 − 8 )2 + ( 6 − 8 )2 + ( 10 − 8 )2 + ( 3 − 8 )2 + ( 2 − 8 )2
+ ( 20 − 8 )2 + ( 13 − 8 )2 + ( 8 − 8 )2
= 36 + 4 + 4 + 25 + 36 + 144 + 25 + 0 = 274
So:
\sum_{i=1}^8 \space(x_i \space {\text{–}} \space \mu)^2 = 274 , n = 8
Variance = \bf{\frac{274}{8}} = 34.25
(2.2)
This time we will look at the list of 8 numbers from example (1.2):
4 , 5 , 4 , 7 , 6 , 7 , 9 , 7 = { x_1 , x_2 , x_3 , x_4 , x_5 , x_6 , x_7 , x_8 }
n = 8 , μ = 6
\sum_{i=1}^8 \space(x_i \space {\text{–}} \space \mu)^2
= ( 4 − 6 )2 + ( 5 − 6 )2 + ( 4 − 6 )2 + ( 7 − 6 )2 + ( 6 − 6 )2 + ( 7 − 6 )2
+ ( 9 − 6 )2 + ( 6 − 6 )2
= 4 + 1 + 4 + 1 + 0 + 1 + 9 + 0 = 20
Variance = \bf{\frac{20}{8}} = 2.5
As can now be seen, the Variance value is larger with the data set of numbers in (1.1) than with (1.2).
Which is what we would expect as the numbers in the lists are closer together in (1.2).
Which shows that the lower the value of the Variance, then generally the less spread out the data set is. With the larger the Variance value, the more spread out a data set is.
What is Variance in Math?
Variance Alternative Formula
When learning about what is variance in Math, it turns out that there is also another formula for the Variance that can be used when required. A formula that can be quicker to use.
The alternative formula for variance is:
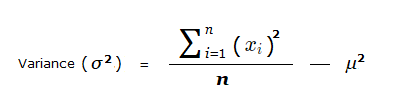
Looking at the numbers 4 , 5 , 4 , 7 , 6 , 7 , 9 , 6 from (2.2), the sums with the formula would be:
σ2 = \frac{\sum_{i=1}^8 \space (x_i)^2}{8} − 62
= \boldsymbol{\frac{(4)^2 \space + \space (5)^2 \space + \space (4)^2 \space + \space(7)^2 \space + \space (6)^2 \space + \space (7)^2 \space + \space (9)^2 \space + \space (6)^2}{8}} − 62
= \boldsymbol{\frac{272}{8}} − 36 = 38.5 − 36 = 2.5
- Home ›
- Probability/Stats › Variance