The ratio introduction page gave an introduction the concept of ratios in Math. With some ratio in statistics examples of how they can be simplified from larger numbers in the original ratio similar to how fractions are simplified.
The subject of ratio scale, is where ratios can be appropriately scaled upward or downward where possible, with the use of division and multiplication.
To obtain the information you desire.
Examples
(1.1)
A cafe sold slices of cake one week in a ratio of:
Strawberry : Chocolate => 1 : 6
If the shop sold 26 Strawberry slices that week, how many Chocolate slices were sold?
We know 26 Strawberry slices were sold. 60 : Chocolate
We know the Chocolate slices sold will be 6 times greater,
so some multiplication can complete this ratio being scaled up adequately.
26 × 6 = 156 => 26 : 156
156 Chocolate cake slices were sold that week.
(1.2)
The ratio of spiders to beetles in a garden is 4 : 1.
If there are 48 spiders, how many beetles are there in the garden?
Solution
We know that 48 spiders are in the garden.
48 : Beetles
The number of beetles in the garden is 4 times less, so this situation now calls for division of 48 by 8 in order to scale the ratio down.
48 ÷ 4 = 12 => 48 : 12
12 beetles are in the garden.
(1.3)
A person works an 11 hour shift, and earns $154 for doing so.
How many dollars did the person earn per hour during the 10 hour shift?
Solution
Here we can set up the ratio as, Hours : Dollars. 11 : 154
Now division by 1 will scale the ratio down appropriately so that the hours part is just 1.
11 ÷ 11 = 1 , 154 ÷ 11 = 14 => 1 : 14
The person earned $20 per hour during the 11 hour shift.
Ratio in Statistics Examples,
Continued Ratio
In Math a ratio can also be in 3 parts as well as just 2 like we’ve seen so far.
When 3 or more quantities are presented in a ratio, it is defined as a “continued ratio”.
Meaning that the ratio is continuing beyond 2 quantities.
Examples
(2.1)
Split $20’000 into the ratio 2 : 3 : 5.
Solution
The ratio 2 : 3 : 5 is 10 parts in total.
$20’000 ÷ 10 = $2000
2 × $2000 = $4000
3 × $2000 = $6000
5 × $2000 = $10’000
So $20’000 in the ratio 2 : 3 : 5 = $4000 : $6000 : $10’000.
(2.2)
A fishing company has 3 boats, A, B and C.

One month 50’000 fish were caught by the 3 boats combined.
The ratio of the fish caught by each mine was,
A : B : C => 4 : 2 : 2.
How much fish did each individual boat catch?
Solution
The ratio of 4 : 2 : 2 is 8 parts in total.
50’000 ÷ 8 = 6250
BOAT A) 4 × 6250 = 25’00
BOAT B) 2 × 6250 = 12’500
BOAT C) 2 × 6250 = 12’500
The ratio for mines A, B and C is, 25’000 : 12’500 : 12’500
Alternatively, one can also use the following sums for situations involving ratios such as with the fishing boats above.
Boat’s catch = Total Amount × \boldsymbol{\frac{Ratio}{Sum \space of \space Ratios}}
So the calculations would be:
BOAT A) = 50’000 × \bf{\frac{4}{8}} = 50’000 × \bf{\frac{1}{2}} = 25’500
BOAT B) = 50’000 × \bf{\frac{2}{8}} = 50’000 × \bf{\frac{1}{4}} = 12’500
BOAT C) = 50’000 × \bf{\frac{2}{8}} = 50’000 × \bf{\frac{1}{4}} = 12’500
(2.3)
In certain situations, it can be necessary to be put 2 or more ratios into a continued ratio.
Say you had 3 different workers at a company that made combined earnings of of $46’000 in one year.
Their combined earnings are divided up between them in ratios such that:
Worker 1 : Worker 2 = 3 : 4
Worker 2 : Worker 3 = 2 : 1
How much in earnings did each individual worker make?
Solution
To properly compare these 3 different worker earnings, we look to put them into a continued ratio.
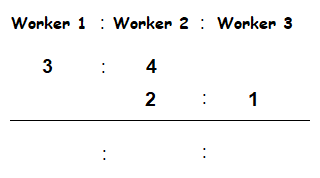
In order to do this, we can write out the workers in a 3 part ratio along side each other.
Then write down the ratios between the workers that we currently know underneath, set up in the following way.
What we can do now is multiply these numbers in the following way, from the left to the right.
Writing the multiplication results we obtain in order underneath, will give us a continued ratio.
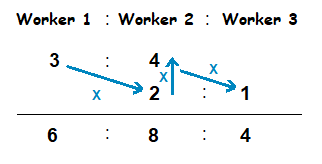
This new ratio we have represents the 3 different worker earnings in a continued ratio.
Worker 1 : Worker 2 : Worker 3 = 6 : 8 : 4
From here we can take either of the approaches already shown in the fishing boats example (2.2).
Sum of Ratios = 6 + 8 + 4 = 18
Worker 1) = 45’000 × \bf{\frac{6}{18}} = 45’000 × \bf{\frac{1}{3}} = 15’000
Worker 2) = 45’000 × \bf{\frac{8}{18}} = 45’000 × \bf{\frac{4}{9}} = 20’000
Worker 3) = 45’000 × \bf{\frac{4}{18}} = 45’000 × \bf{\frac{2}{9}} = 10’000
Of the $45’000 total combined earnings.
Worker 1 made $15’000, worker 2 made $20’000 and worker 3 made $10’000.
- Home ›
- Probability/Stats › Ratio, Continued Ratio