1. Sample Standard Deviation Formula
2. Standard Deviation Comparison
3. Sample Standard Deviation Example
Along with finding the complete standard deviation of a set of data, we can also find the sample standard deviation if we wished.
The sample standard deviation is a measurement that is very useful for times when you would like to get a good idea of the standard deviation of a perhaps a very large group, but without having to use all the values in the whole group.
Now there was a formula for complete standard deviation, and there is also a formula for sample standard deviation that can be used.
Sample Standard Deviation Formula
The formula for the sample standard deviation is the following.
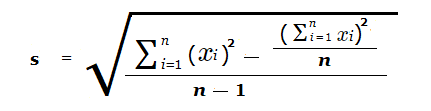
Where we have n being the size of the sample of data, and not the size of the whole complete group.
Standard Deviation and
Sample Standard Deviation Comparison
To show sample standard deviation in practice, we can look at a random list of 10 numbers.
We will work out the complete standard deviation, then proceed to work out a sample standard deviation from just some of the 10 numbers.
Total amount of values. n = 10
Average/mean ( μ ) = \bf{\frac{7 \space + \space 11 \space + \space 14 \space + \space 12 \space + \space 9 \space + \space 10 \space + \space 8 \space + \space 9 \space + \space 12 \space + \space 18}{10}} = 11
Standard Deviation:
Standard Deviation = \sqrt{\frac{\sum_{i=1}^n \space (x_i)^2}{n} \space – \space \mu^2}= \bf{\sqrt{\frac{7^2 \space + \space 11^2 \space + \space 14^2 \space + \space 12^2 \space + \space 9^2 \space + \space 10^2 \space + \space 8^2 \space + \space 9^2 \space + \space 12^2 \space + \space 18^2}{10} \space {\text{–}} \space 11^2}}
= \bf{\sqrt{130.4 \space – \space 121}} = \bf{\sqrt{9.4}} = 3.07 ( to 2 decimal places )
Looking at a range 1 standard deviation away from the mean:
11 − 3.07 = 7.93 , 11 + 3.07 = 14.07
So we should expect that the majority of the values in the list of numbers would be between 7.93 and 14.07.
This does turn out to be the case, as only 18 happens to lie outside the range of one standard deviation away from the mean/average.
Sample Standard Deviation:
Now we will look to take a sample standard deviation, using 5 of the 10 numbers as a sample.Selection of 5 numbers from the list: 7 , 8 , 9 , 10 , 18
Amount of values. n = 5
Average/mean ( μ ) = \bf{\frac{7 \space + \space 8 \space + \space 9 \space + \space 10 \space + \space 18}{5}} = 10.4
Sample Standard Deviation = \sqrt{\frac{\sum_{i=1}^n \space (x_i)^2 \space {\text{–}} \space {\frac{(\sum_{i=1}^nx_i)^2}{n}}}{n \space {\text{–}} \space 1}}
= \bf{\sqrt{\frac{(49 \space + 64 \space + \space 81 \space + \space 100 \space + \space 324) \space {\text{–}} \space {\frac{2704}{5}}}{4}}} = \bf{\sqrt{19.3}} = 4.39
Again now looking at a range of 1 sample standard deviation away from the sample mean/average.
10.04 − 4.39 = 5.65 , 10.04 + 4.39 = 14.43
Result
These new calculations to find the sample standard deviation, indicate we should expect most of the values in the complete list of 10 numbers to be between 5.65 and 14.43.
Again this does turn out to be the case, as it is still only 18 that lies outside this range in the whole complete list
So the Sample Standard Deviation does still give a fairly accurate result for the larger group.
Find the Sample Standard Deviation
Example
(1.1)
A person who plays golf at a country club with 100 members, would like to know roughly how many rounds each member played in one week.
They want to get a good measure of how spread out the results would likely be.

Instead of asking all 100 members, the person decides to take a random sample of 9 members.
In order to get an idea of what the rounds played results would likely be for the whole 100 members.
The number of rounds played for sample of 7 members were:
Mean = \bf{\frac{1 \space + \space 4 \space + \space 2 \space + \space 2 \space + \space 5 \space + \space 8 \space + \space 3 \space + \space 2 \space + \space 3}{9}} = \bf{\frac{26}{9}} = 2.89 , n = 9
Now to obtain the Sample Standard Deviation s with these values.
s = \bf{\sqrt{\frac{1^2 \space + \space 2^2 \space + \space 2^2 \space + \space 2^2 \space + \space 3^2 \space + \space 3^2 \space + \space 4^2 \space + \space5^2 \space + \space 8^2 \space \space {\text{–}} \space \space {\frac{(30)^2}{9}}}{9 \space {\text{–}} \space 1}}}= \bf{\sqrt{\frac{136 \space \space {\text{–}} \space \space {\frac{900}{9}}}{8}}} = \bf{\sqrt{\frac{36}{8}}} \bf{\sqrt{4.5}} = 2.12
2.89 − 2.12 = 0.77 , 2.89 + 2.12 = 5.01
From the results of the sample of 9 club members.
It’s reasonable to assume that for the whole group of 100 club members:
The average number of rounds played in the one week studied should be around 3.
With the majority of the rounds played results being between 0.77 and 5.01.
So effectively between 1 and 5 rounds played.
- Home ›
- Probability and Statistics › Sample Standard Deviation