The Cartesian coordinate system is commonly used when drawing the graphs of functions and equations in Math.
It is sometimes referred to a the rectangular coordinate system, and is quite straight forward to understand.
This page will show some examples of how to plot points and draw graphs or shapes.
Cartesian Plane:
Before looking at more specific plotting and drawing examples, we need to have a clear understanding of what the Cartesian plane is.
There are 2 axis on the plane, a vertical y axis, and a horizontal x axis, this pair of axes create 4 different quadrants in the Cartesian plane.
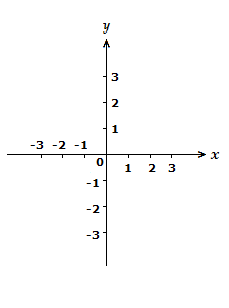
As can be seen, both the x and y axis go in a positive and a negative direction, from the centre point.
The centre point of the axes is often referred to as the origin.
A coordinate on the Cartesian plane will have an x value and a y value together, written in brackets, (x,y).
So the coordinates of the origin are (0,0).
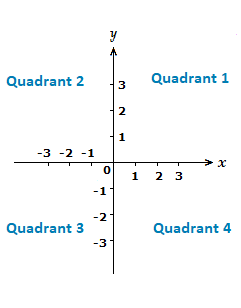
The quadrants themselves also have specific numbers to represent them. Starting at the top right with 1, and then moving anti-clockwise to 4 in the lower right.
Cartesian Coordinates
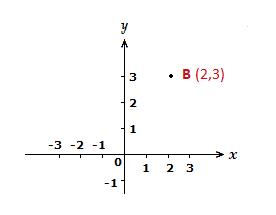
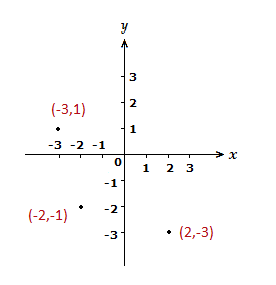
As mentioned, a point on the Cartesian plane will have a coordinate (x,y).
We can see how this works with a random point, let’s say B (2,3).
As the coordinate is in the form (x,y), for B we go 2 places along the x-axis, then 3 places up the y-axis.
Coordinates can have negative values for the x and y values also, with points possibly being in any of the 4 quadrants.
Example
(1.1)
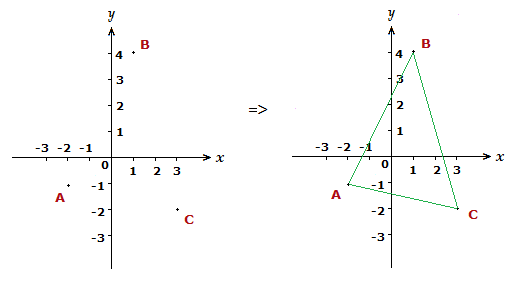
Plot and draw a triangle on the Cartesian plane that has vertices at coordinates A(-2,-1), B(1,4) and C(3,-2).
Solution
For Cartesian coordinate system examples such as this, the approach is to plot the relevant points, then connect them up to form the correct shape.
Cartesian Coordinate System Examples,
3D Cartesian Plane
We can also have a Cartesian plane in three dimensions or 3D.
For such Cartesian coordinate system examples, a z axis is introduced and included with the x and y axis.
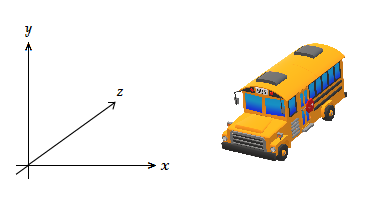
A point or coordinate in the 3D axis would be of the form (x,y,z).
The x and y axis are still vertical and horizontal respectively, but the z axis means we can move a point closer to us, or further away.
We’ll draw a three dimensional cuboid in a 3D Cartesian axis below, to try and show how things work.
Understanding a 3D axis is particularly important when it comes to the topic of vectors.
Example
(2.1)
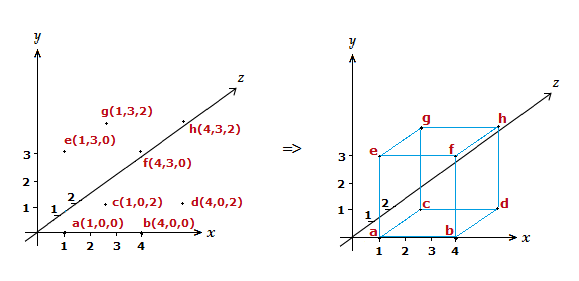
On a 3D Cartesian axis draw a three dimensional cuboid with the following 8 vertices.
a (1,0,0) , b (4,0,0) , c (1,0,2) , d (4,0,2) , e (1,3,0) , f (4,3,0) , g (1,3,2) , h (4,3,2)
Solution
The approach is the same as with a 2D axis, plot the relevant vertices then join them up to form the shape.